How to spot retention risk early
Sparko People scores retention from data your company already keeps in the HRIS: engagement, performance, recognition, growth, time off and tenure. You see who may leave next, why, and what to do about it, on one page.
This guide walks through the screens an HR lead uses each week, from the company-wide risk mix to acting on a single flag.
Start with the company-wide risk mix
Open Engagement, then the Retention tab. The risk mix shows how many people sit in each band (High, Medium, Watch, Low and Insufficient data) and how the bands moved over the last 30 days.
The mix is counts only, never names, and it stays hidden until at least five people are scored so a count never points at a person. Every plan includes it.

The risk mix: 245 people scored, with each band as a count and a share. See which signals track people leaving
On the Engagement dashboard, Key drivers compares each engagement area with real departures, not with the score itself. A negative number means lower scores on that area went with people leaving.
Sparko reports a driver only when there are enough departures to say something, and labels it as association rather than cause.
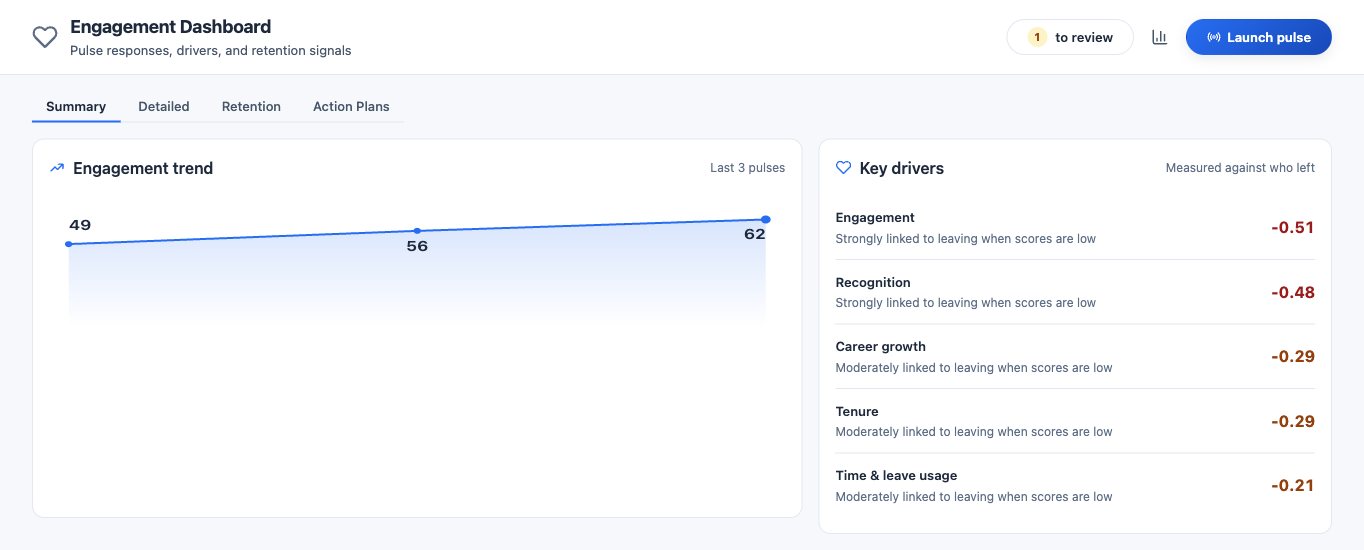
Key drivers, measured against who left. Pulse surveys feed the trend on the left. Open the list of who may leave next
Go to Analytics › Retention. The High, Medium and Watch tabs list people by band, with their risk, the change since their last score and the top factor behind it.
A score counts an area only when Sparko has real data for it, so someone with too little data goes to Insufficient data instead of getting a guess. Drafts and goals still in progress never count as misses.
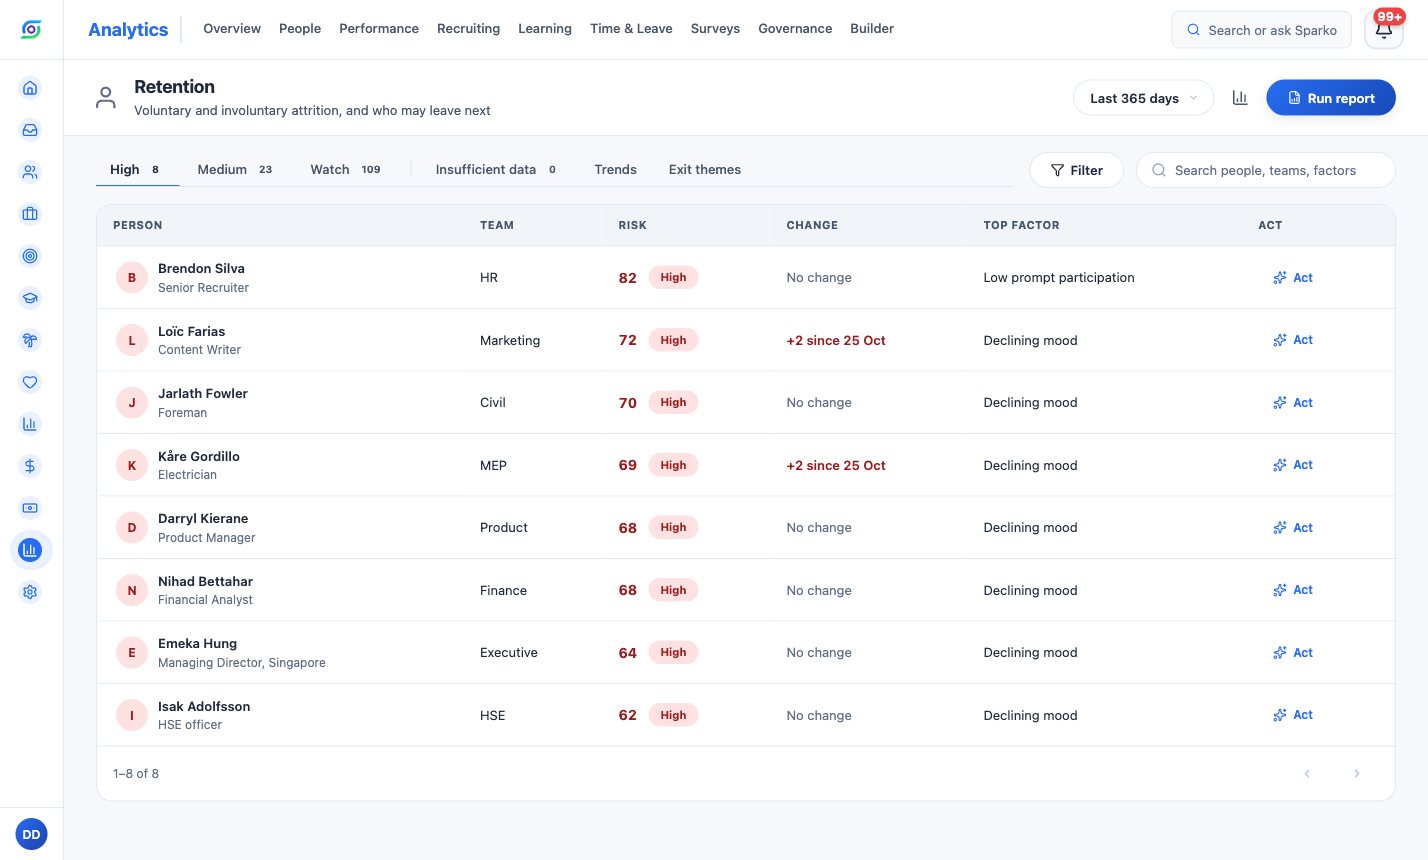
The High tab: risk, change since the last score and the top factor for each person. Act on one flag
Select Act on a High or Medium row. The panel shows why the person was flagged, then offers one action: propose a retention pay change or schedule a 1:1 with their manager.
You type any pay increase yourself; Sparko never suggests a figure, and the change goes through your normal approval chain. A 1:1 never mentions the flag. Before you confirm, the panel says what will happen next, and the score is saved with your action so you can later see whether acting kept people.
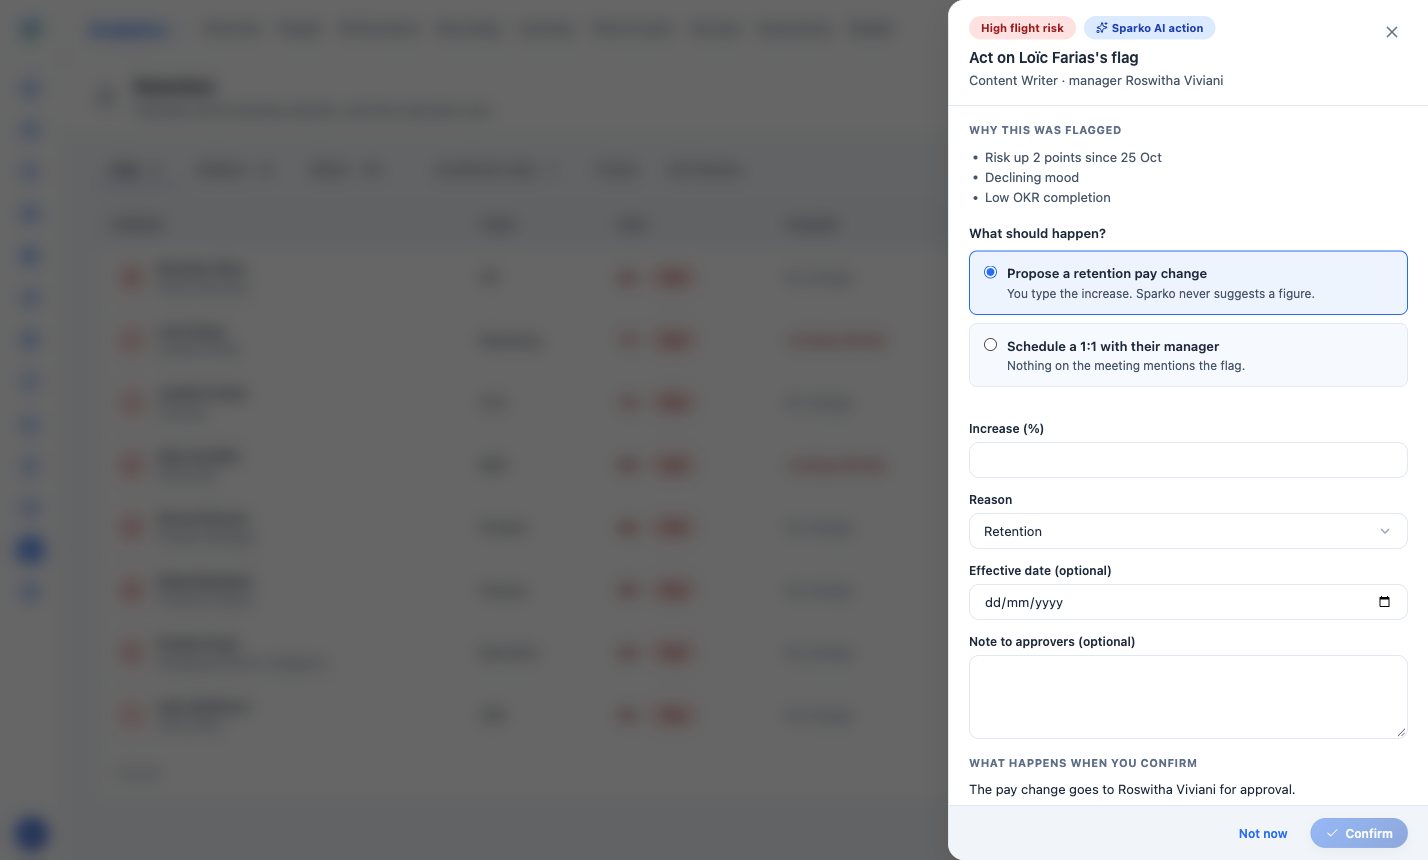
One action per flag, with the reasons and the next approver in view. Watch the trend and the reasons people give
The Trends tab shows monthly voluntary attrition, exit reasons from exit interviews, and a department by month heatmap that makes seasonal patterns easy to spot.
On Business, Exit themes groups scrubbed exit-interview answers into recurring themes, each with its share of exits and a recommendation. A theme appears only when it covers five or more exits.
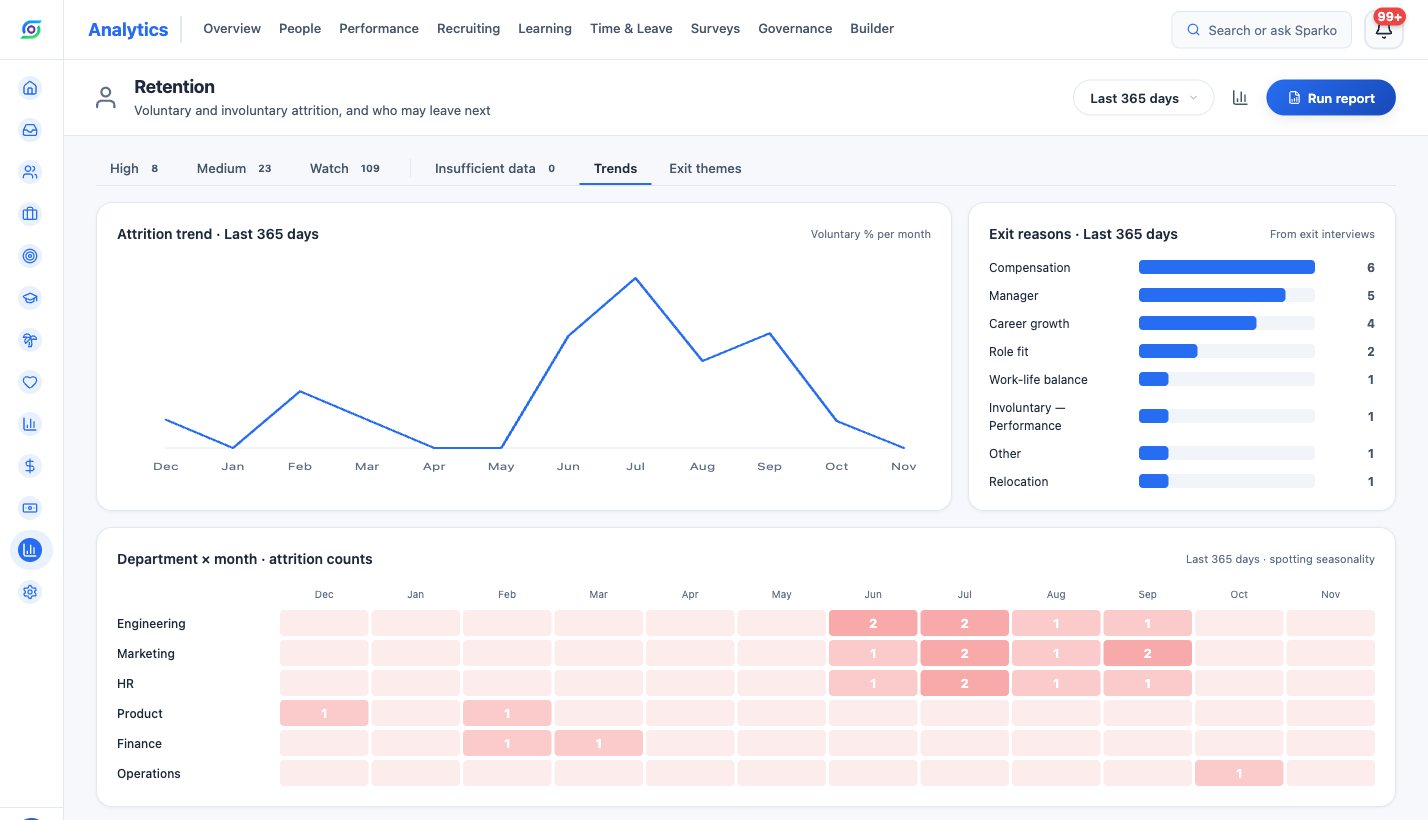
Attrition trend, exit reasons and the department by month heatmap.
What each plan includes
Plans are Core, Growth, Business and Custom. Compare plans and prices.
Questions
What goes into a retention score?
Six areas from your own HRIS data: engagement, performance, recognition, growth, time off and tenure. An area counts only when there is real data for it, and someone with real data in fewer than three areas is listed as insufficient data with no score.
Can employees see their own risk score?
No. Your own score is never shown to you, in the list or in the risk mix, and your own flag never appears on your list.
Does Sparko decide what to do about a flag?
No. A person chooses one action per flag. For a pay change you type the increase and it goes through your approval chain; Sparko never suggests a figure.
How do I know the scores are any good?
The summary stats on the Retention page include model accuracy: lift, precision, recall and a calibration table that grades past risk bands against who actually left.
Try it in your own workspace. Sparko People is free for 14 days, no credit card required.